×
Houston's NO2 Equality Map
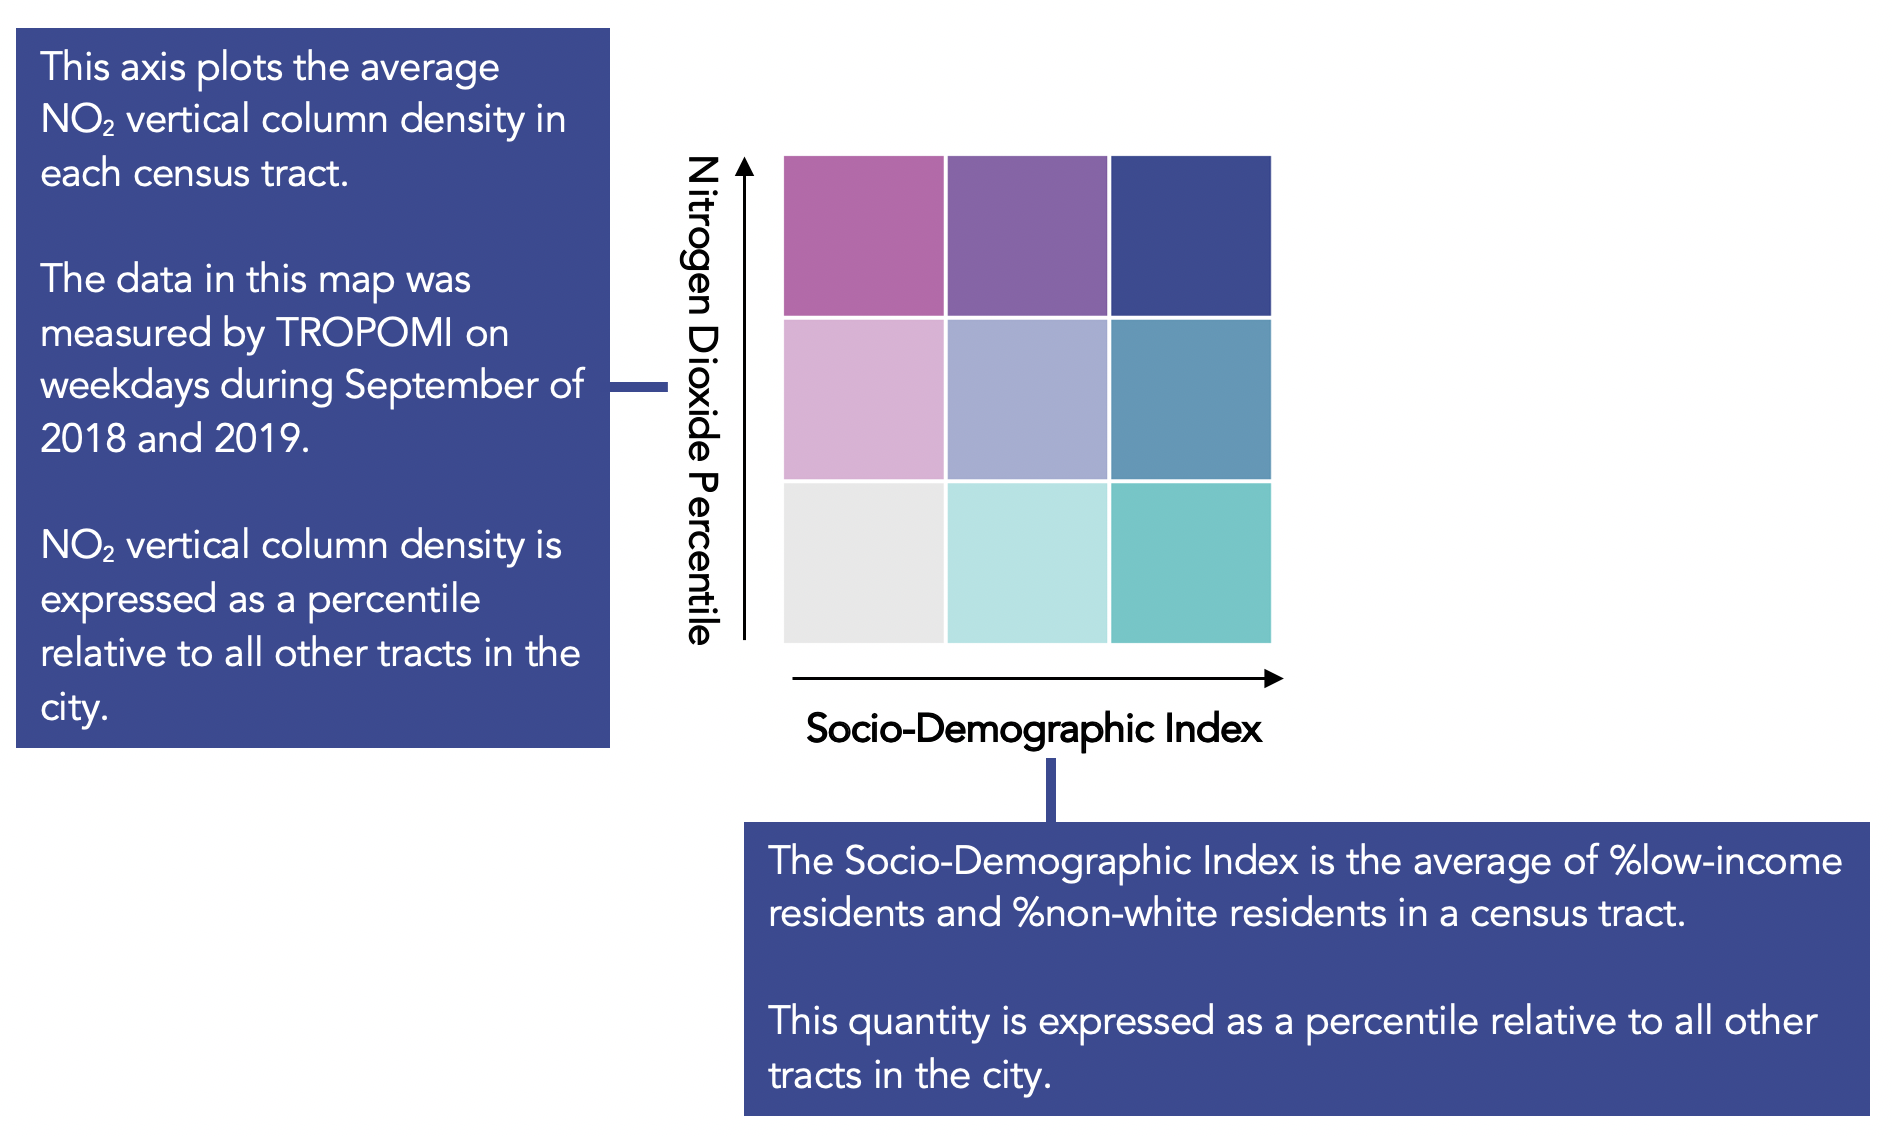
Where we live, work, and spend our time affects how much nitrogen dioxide (NO2) and other air pollutants we breathe. Many primary pollutants, including NO2, vary between neighborhoods in the same city. On average, Houston’s low-income residents and residents of color experience 30% higher burdens of NO2.The NO2 Equality Map aims to draw attention to this injustice as it compares NO2 column densities and socio-demographic vulnerability. The NO2 Equality Map currently displays data measured from space by TROPOMI on weekdays (September 2018 and 2019) at the census tract level. In the future, the NO2 Equality Map will update in real time.
Enter