About the Data
Why Nitrogen Dioxide?
Nitrogen dioxide (NO2) is a gas that mainly forms from the burning of fossil fuels. NO2 can have harmful effects on the lungs. It can produce ozone, another air pollutant, and acid rain, which can harm plants and wildlife. Although NO2 has its own effects on health and the environment, it is also used as an indicator of air pollution in general.
Measuring Nitrogen Dioxide From Space
Ground-based instruments are stationed on Earth's surface and provide local measurements of air quality. Ground-based measurements are only available where instruments are stationed.

Sentinel-5 Precursor monitors the Earth's atmosphere. Image: ESA
In contrast, satellite-based air quality measurements offer global coverage. The Sentinel-5P is a satellite in low Earth orbit. It carries TROPOMI, an instrument that measures trace gases by comparing the light reflected from Earth’s atmosphere with direct sunlight.
Spatial resolution refers to the amount of land or water represented by one pixel in a satellite image. An image with high spatial resolution is more detailed, while an image with low spatial resolution provides more generalized information.
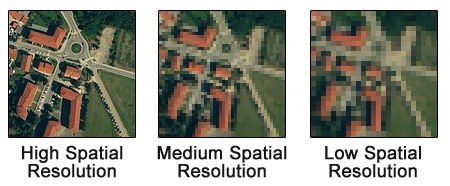
The same subject captured at different levels of spatial resolution. Image: GISGeography
TROPOMI offers a pixel size of about 7 × 3.5 km2. This spatial resolution is so high that we can compare NO2 density between neighborhoods of the same city. TROPOMI measures nitrogen dioxide in terms of vertical column density. We take that information at the pixel level and average it to census tracts. Finally, we convert that value to a percentile relative to all other census tracts in a city. Houston's Air Pollution Injustice Map currently displays the average NO2 density in September 2018 and September 2019.
Demographic Data
All demographic data in Houston's Air Pollution Injustice Map comes from the U.S. Census Bureau. To quantify demographic data, we created a demographic index. The demographic index reflects the average of the percent non-white residents and the percent low-income residents in each census tract. It is represented as a percentile relative to all other tracts in the city.